
ABOUT THIS COMMUNITY DASHBOARD
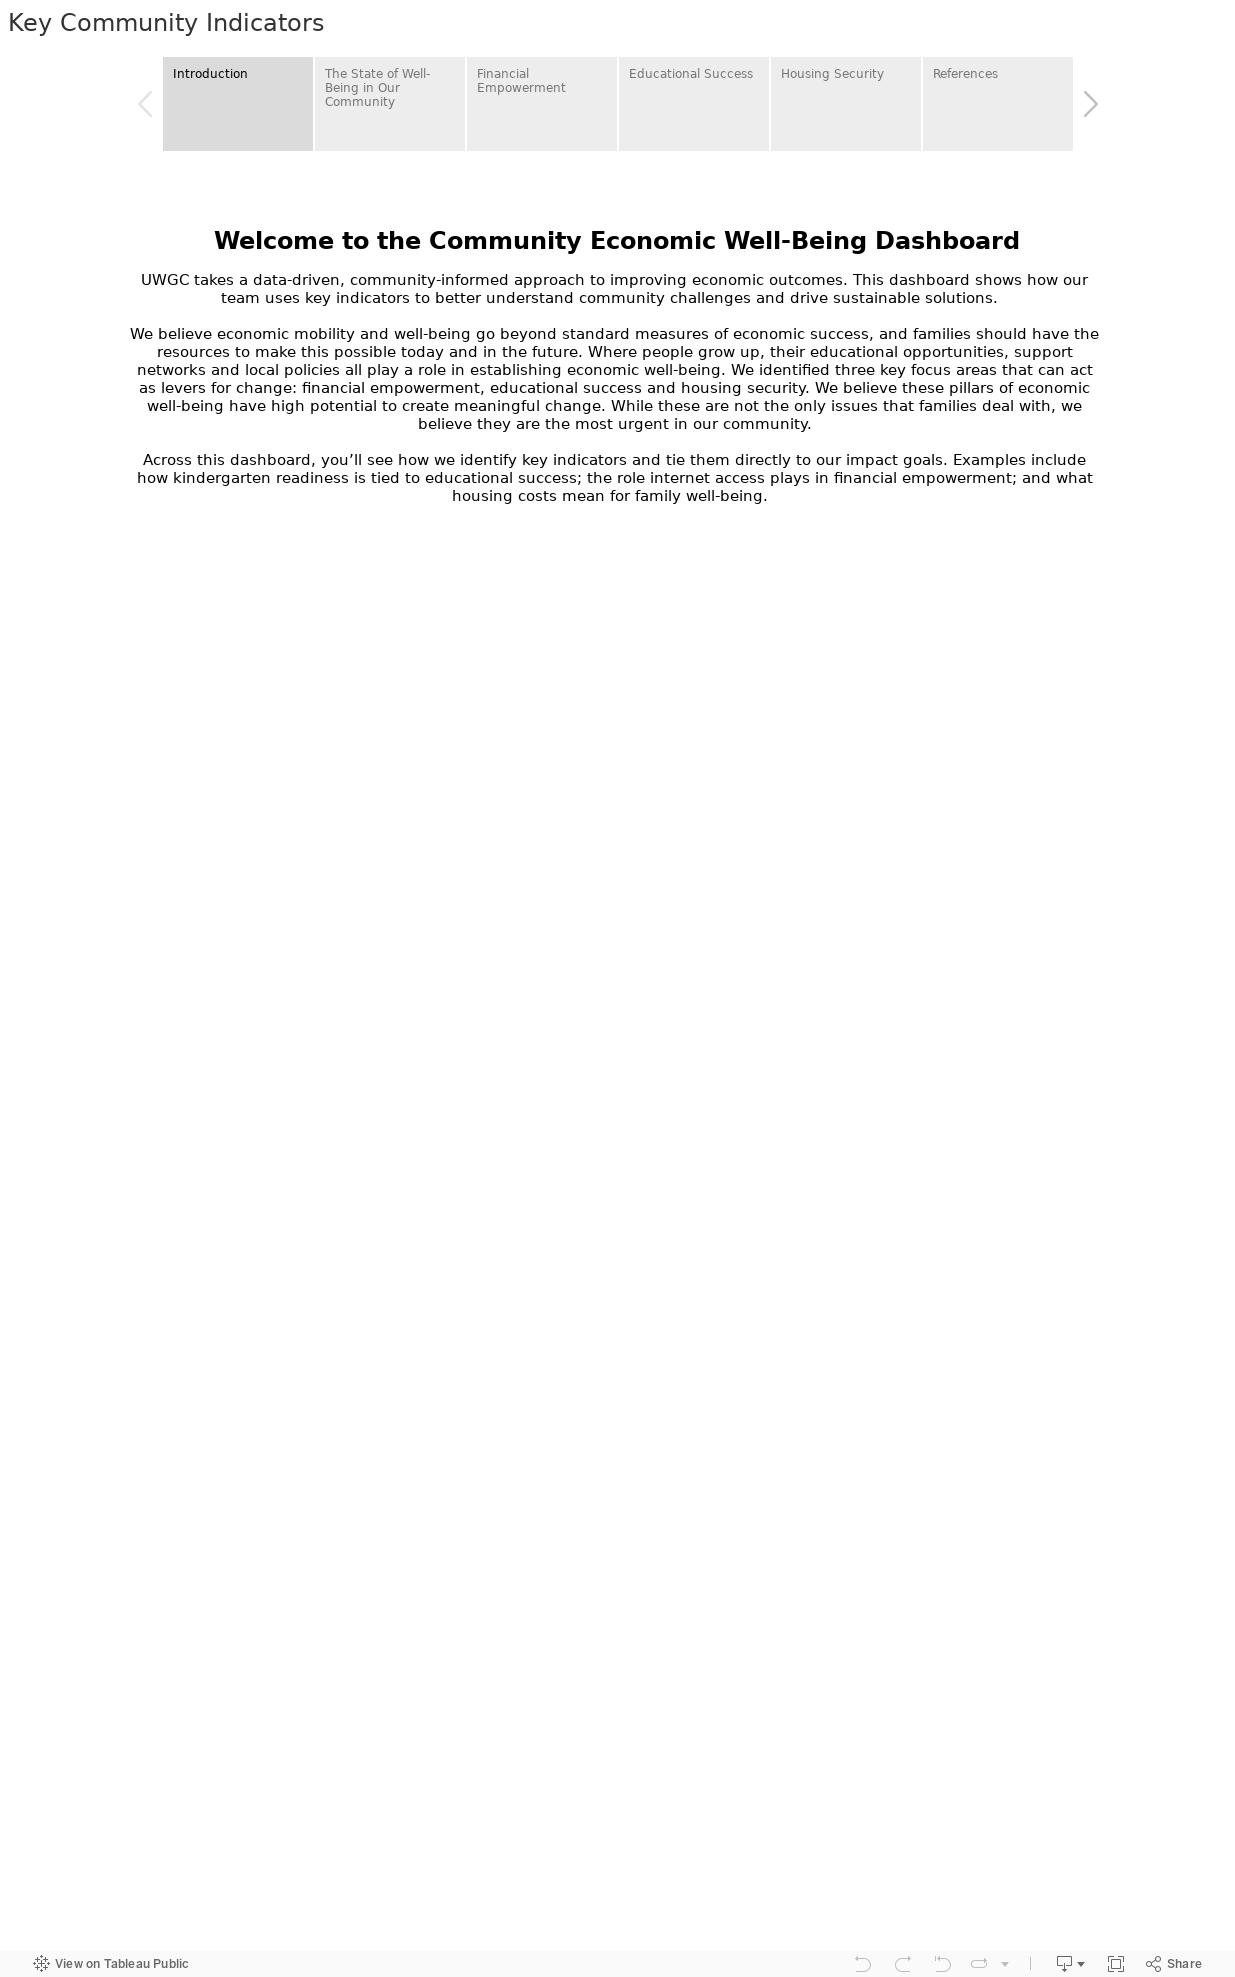
UWGC takes a data-driven, community-informed approach to improving economic outcomes. This dashboard shows how our team uses key indicators to better understand community challenges and drive sustainable solutions.
At the United Way of Greater Cincinnati, data drives our actions.
Across this dashboard you’ll see how we’re using key community indicators to inform our understanding of the community challenges and drive solutions to make a positive impact. Dashboard data is sourced primarily from public sources, most are available through government departments, and figures will be updated annually as data becomes available.
The dashboard can be used to answer a wide range of impact questions, such as:
- What is the current state of well-being within the region?
- Where do we see differences in outcomes across our region (i.e., demographics, zip codes, etc.)?
- How do dashboard insights inform United Way's work?
WANT ADDITIONAL INSIGHTS?
For additional data on community-wide indicators, explore our online mapping tool open_in_new created in partnership with PolicyMap.
Users can click through to examine how various factors contribute to economic well-being and mobility. They may notice related inequities that exist in our community.
For a tutorial on how to navigate the dashboard, please reference the video below the dashboard.

UNITED INSIGHTS & REPORTS
Our in-depth reports and case studies paint a true-to-life picture of the status of our community, where life is improving and how much further we need to go.

ABOUT UNITED KNOWLEDGE & INSIGHTS
Learn more about the United Knowledge & Insights project and how United Way of Greater Cincinnati is leveraging data to improve our community.

UNITED WAY POLICYMAP
For additional data on community-wide indicators, explore our online mapping tool open_in_new created in partnership with PolicyMap.